MEASURING
THE FINANCIAL PERFORMANCE OF BHARAT SANCHAR NIGAM LTD. IN BHOPAL USING RATIO
ANALYSIS
Stella Masih
Research
Scholar
Department of commerce
Barkatullah
University, Bhopal (M.P)
ABSTRACT:
This study use ratio analysis to evaluate Bharat Sanchar
Nigam Ltd.'s (BSNL) financial standing in Bhopal. Financial health was assessed
by looking at liquidity, profitability, and solvency measures for 2018, 2019,
and 2020. The ratio research showed that BSNL has serious money problems since
the company's liquidity, profitability, and solvency ratios are all poor. A
fall in the company's current ratio and quick ratio over time indicates that
meeting short-term commitments may be difficult for BSNL. The company has been
losing money and failing to generate positive returns for its investors since
its net profit margin ratio, return on assets ratio, and return on equity ratio
are all below zero. The increasing debt-to-equity ratio, debt-to-total-assets
ratio, and interest coverage ratio all indicate that the company is more
dependent on debt financing rather than equity funding. This indicates that the
corporation may have trouble generating enough revenue to meet its interest
expenditures. Based on the results of this study, BSNL should make certain
strategic adjustments to boost its bottom line. The recommended measures, such
as better working capital management, debt reduction, revenue growth, and
customer service improvement, may aid the firm in overcoming its financial
difficulties. BSNL's overall financial health is in a vulnerable state, and the
corporation has to take immediate measures to strengthen its bottom line.
Keywords: BSNL,
Liquidity, Profitability, Solvency Ratios, Debt-to-Equity Ratio and Ratio
Analysis.
INTRODUCTION
Bharat Sanchar Nigam
Ltd. (BSNL) is an Indian telecommunications corporation controlled by the
government that serves millions of people with landline, mobile, and internet
services. Despite its prominence in India's telecommunications sector, BSNL has
been struggling financially in recent years due to falling income, rising debt,
and negative profitability. Increased competition, shifting consumer tastes,
and an antiquated IT infrastructure are all blamed for the company's financial
woes. In order to overcome these obstacles, BSNL must make strategic
adjustments to its business model to boost its financial performance and ensure
its long-term viability. This study's objective is to use ratio analysis to the
question of how well BSNL is doing financially in Bhopal. Using historical data
and industry standards, analysts may get valuable insight into a company's
financial performance with the use of ratio analysis. The purpose of this
research is to analyze BSNL's liquidity, profitability, and solvency ratios in
order to determine the company's strengths and weaknesses and to propose
strategic adjustments that would strengthen BSNL's financial situation. The
study is organized as follows. First, we provide a high-level summary of BSNL
and its function within the Indian telecommunications sector. Next, we'll go
through the value of ratio analysis in assessing a business's financial health
and the significance of analyzing financial performance. We next survey the
literature on ratio analysis as a tool for gauging financial performance, with
an emphasis on the telecommunications sector. Data sources and analytical
methods are discussed in detail inside the methodology section.
REVIEW OF LITERATURE
When the Department of
Telecommunications (DOT) was divided in 2000, BSNL and Mahanagar Telephone
Nigam Ltd. (MTNL) emerged as distinct companies. The firm offers fixed-line,
mobile, and internet services throughout all 22 telecom circles in India. BSNL
is one of the major telecom firms in India, with over 118 million mobile users
and 15 million landline subscribers as of March 2020. Private sector
competitors like Reliance Jio, Bharti Airtel, and Vodafone Idea have been
quickly increasing their network coverage and providing competitively priced
data and voice plans, making it difficult for the firm to retain users.
Ratnaningsih et. al [1],
The purpose of this research is to examine the liquidity ratio, solvency ratio,
activity ratio, and profitability ratio found in the financial statements of
telecoms companies trading on the Indonesian stock market over the years
2015-2019. The liquidity ratio, solvency ratio, and annual profitability ratios
all go in this direction. The results for PT Telekomunikasi Indonesia have been
excellent. The company's liquidity ratio, solvency ratio, activity ratio, and
yearly profitability ratio have all improved, proving this.
Gagan Shankhdhar et al.
[2], The development and progress of India have always relied heavily on the
efforts of the Indian Telecom Industry. It was crucial in the digitalization of
systems and processes in several economically significant fields. There are
about 1.18 billion active users in India. Mobile or wireless users account for
the bulk of this statistic. The need for faster network connections and more
data consumption have all contributed to the telecom industry's rapid growth in
recent years.
Dr. Mohmad Mushtaq Khan
et al. [3], competition in the Indian telecom industry has heated up with the
introduction of Reliance Jio. In a more cutthroat business climate, companies
have been merging. One telecom firm has gone bankrupt because of the pricing
war among competitors, while other firms in the industry have showed poor
profitability as a result.
Bhavik Barot et. al [4],
India now has the world's second-largest market for telecoms. The country's
overall subscriber base was 1,183,49 million as of January 2021, while the
telecom industry's gross revenue was $9.35 billion in the third quarter of
fiscal year 2021. For the last five years, small businesses have been severely
impacted by the industry leader's harsh crushing of the industry.
Chopra et al. [5],
assess the development of India's telecom industry in terms of its ability to
innovate and generate IP. Domestic Indian telecom enterprises need to be
globally competitive and hold a higher position in the telecoms value chain for
the telecom industry as a whole to prosper economically. In order to encourage
investment in the growth of technical capabilities via R&D, researchers say
that India's legislative emphasis should move toward fostering and safeguarding
intellectual property.
Singh R. et al. [6],
Reliance Jio's massive market entrance causes several sudden and unexpected
shifts in customer behavior and 45 perceptions. This causes anxiety, and major
service providers in the industry are discussing possible mergers and
acquisitions as a result. He went on to say that tiny participants in the
business have a very hard time making a living because of the high barriers to
entry in the industry.
Adebayo, A. A., and Ekejiuba
et al. [7], the telecommunications industry is crucial to the progress of any
nation's economy because of the substantial contributions it makes to the gross
domestic product of any given state. Growth is limited only by the quality and
extent of the underlying communications infrastructure.
Raza, D. et al. [8],
emphasis their analysis of the Indian telecom industry's financial performance,
zeroed emphasis on Bharat Sanchar Nigam Limited and Bharti Airtel for
comparison. Financial analysis and interpretation of the two companies' results
show that Bharti Airtel outperformed BSNL, which is significant because the
telecom industry in India is crucial to the growth of the country and other
industries.
RESEARCH METHODOLOGY
1. Research Objectives: To know and analyze
financial performance of BSNL in Bhopal Region.
2. Research Design: Descriptive research
design. It describes trends in profitability, liquidity, solvency.
3. Type of Research: Current research work is
descriptive research in nature.
4. Sample Plan: The plan design with
studied financial performance of last five years viz. 2015-16 to 2019-20.
5. Evaluation Criteria: Researcher have examined
financial performance with the help of ratio analysis. We have examined
financial performance based on following criteria.
5.1. Profitability: We have examined
Profitability with the help of following three ratios:
·
Gross Profit Margin = (Total Revenue – Cost of Goods Sold)/Total
Revenue x 100.
·
Operating Margin= (Operating Income /Total Revenue) x 100.
·
Net Profit Margin= (Total Revenue – Cost of Goods Sold)/Total
Revenue x 100.
5.2. Liquidity: Telecom companies are service providers. Hence
there is no stock of goods. Thus in the current research work we have
considered current ratio as indicator of liquidity.
·
Current Ratio= (Current Assets/Current Liabilities)
5.3. Solvency
·
Debt Equity Ratio= Total Liabilities/Total Shareholder’s Equity
·
Interest Coverage Ratio = Earnings Before Interest and
Tax/Interest Expenses
6.
Source of Data: Researcher have obtained data from annual
reports of respective companies.
7.
Statistical Tool: Excel
DATA ANALYSIS
Profitability Analysis and Interpretation of BSNL
Table 1: Profitability Ration Analysis (Source: Annual Report of
BSNL)
|
Financial Year |
Gross Profit Margin (%) |
Operating Margin (%) |
Net Profit Margin (%) |
|
2017-18 |
36 |
20 |
13 |
|
2018-19 |
37 |
18 |
-15 |
|
2019-20 |
34 |
9 |
0 |
|
2020-21 |
31 |
1 |
-4 |
|
2021-22 |
39 |
2 |
-64 |
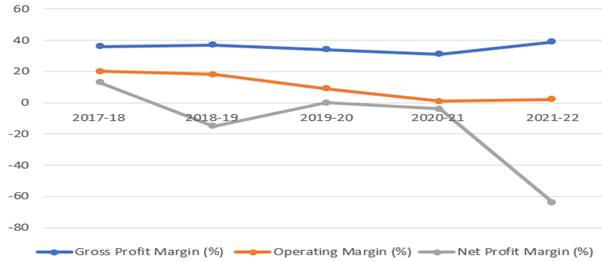 Figure 1: Graphical
Analysis of Profitability Ration Analysis (Source: Annual Report of BSNL)
Figure 1: Graphical
Analysis of Profitability Ration Analysis (Source: Annual Report of BSNL)
On the basis of above chart we can conclude that there is high
volatility has been observed in case of Operating Margin and Net Profit Margin
both. In case of Gross Profit Margin consistence has been observed as compared
to other two parameters of the Margin or Profitability ratios [10].
Out of total five years of study only first year of study shows
Profitable condition of the company. Since 2018-19 company is making loss. An
attempt of recovering loss has not been successful. In the last year of study
net loss of the company after considering every expenses were mounted to Rs 56
cores.
Operating margin trend is also showing downward trend in span of
four years. In the first three years of study margin is constantly reduced. In
a span of three years’ operating margin is reduced by 50%. In fourth year of
study company has lost Operating margin and stand at a position of no profit no
loss. But after some efforts from management Side Company has regained
profitability marginally.
Gross Profit margin shows profitability of company after considering
expenses of basic services and with considering administrative and other
incidental cost [11]. Company has managed Gross Profit Margin ration decently
in the first three years of study. In the fourth year company has faced set
back and there is minor reduction in the gross profit. However, in the last
year of study company has recovered it to great extent. Decent growth in the
Gross Profit has been observed [12].

Figure 2: Graphical Representation of Current Ration
Current ratio is indication of working capital status of the
company. The above chart has depicted that company has constantly maintained
Current Assets in the company. Ideal ratio is 2:1 but in the Telecom sector it
is extremely difficult to maintain such. Telecom Company is service Provider
Company. Hence they are always without stock. Absence of stock in the balance
sheet makes liquid ration and current ration equal. IN the first three years of
research current ratio has been increased from 0.41 to 0.49. From the financial
year 2020-21 it has been reduced. Thus company is failed to maintain required
current assets during 2020-21. However, in the year 2021-22 due to better
operational activities ratio has been reached to 0.63.
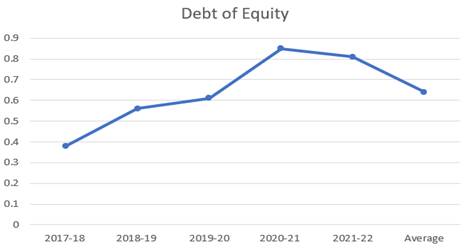
Figure 3: Graphical Representation of Debt of Equity
Debt equity ratio indicate amount of debt in comparison of equity
share capital of the firm. Lower the ratio better the financial situation.
Looking to the above chart we can conclude that for the first four years of
study shows constant growth of debt as compared to equity. This situation
indicates that firm is getting debt constantly from outside. Such inflow has
increased debt as well as increase its servicing cost i.e. Interest cost.
Marginal debt has been repaid in the year 2021-22. If we look at an average,
then we can say that there is debt equity ratio of 0.64. Thus we can conclude
out of one-rupee equity 64 paise debt has been generated. This is not healthy
sign of the organization. Amount of debt in comparison of equity has been
increased more than 100% in a span of four years. This show insignificant
managerial skill of utilizing fund in the business.
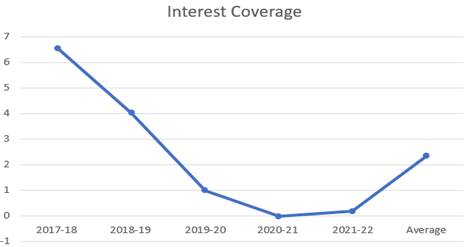
Figure 4: Graphical Representation of Interest Coverage
The interest coverage ratio measures how many times a company can
cover its current interest payment with its available earnings. Ability of firm
to make payment of debt was very high at the first year of study. But from the
second year of study the ability to pay debt has been reduced to great extent.
And in the fourth year of study it was negative [13]. Hence we can say that in
the fourth year of study it has been observed that firm is not able to repay
interest burden created out of the debt. The result is matching with the
previous ratio of debt equity ratio. First had taken significant amount as debt
to run the organisation and it hampers firm’s profitability to great extent.
Firm has slightly recovered his position or ability to repay interest cost in the
fifth year of study [14]. However, such recovery is negligible fully. On
average firm has achieved Interest Coverage Ratio of 2.33.
FINDING AND DISCUSSIONS
·
Gross Profit margin is satisfactory during entire period of study.
Average Gross Profit Margin of the firm is 36% in span of last five years can
be considered to be good efforts of firm.
·
Operational Profitability of the firm is reducing constantly since
2018-19. This reduction in the profitability affect adversely to the Net Profit
Margin and Return on Capital Employed also.
·
Very high volatility has been observed in case of Net Profit
Margin Ratio. Uncertainty of income consistency leads to focus on non-core
business.
·
Basic Earnings Per share is in negative in three years of study.
·
Even though there is negative Net Profit of the firm, firm has
declared dividend consistently in all five years of study.
·
Debt Equity ratio shows portion of debt in the firm in comparison
ot equity. Firm is not able to keep the ratio lower during period of study. IN
the first year of study it was just 0.38 and it has been raised to 0.81 in the
year 2021-22.
·
Over all consistency has been observed in the debt of the firm as
compared to equity. Thus we conclude that firm has not off load its debt.
·
Ability of firm to repay debt in the interest coverage ratio was
satisfactory in the first two years of study. However, it has been detoriated
in last three years of study to great extent. However, average figure of
interest coverage is satisfactory.
·
Utility of assets for generating turnover is satisfactory. Though
Average ratio shows efficient use of assets firm, over all downward trends has
been observed in all five years of study.
·
Current Ratio indicating higher level of current liability as
company to current assets. Low current ratio indicates inefficiency of
management of the company.
CONCLUSIONS
In this study researcher has evaluated the financial performance
of the one large company, BSNL in Bhopal
region. Researcher has evaluated financial performance through ratio analysis
which shows more volatility in selected time span of last five year from
2017-18 to 20-22. In case of Profitability considering gross profit and net
profit BSNL is performing better, In case of Liquidity, BSNL company are
perform well. To measure solvency researcher has used the debt equity ratio and
interest coverage ratio in analysis. BSNL is performing better, so overall we
can conclude that over a five year of period BSNL’s financial performance was
better than other govt initiated telecom companies in financial performance.
LIMITATION AND FUTURE SCOPE
OF STUDY
Current research work is based on the past year data on financial
performance of selected telecom companies. With the current dynamic environment
of business, financial performance of telecom companies keep changing, so
further research can be done in this field.
REFERENCES
[1] Ratnaningsih, Rr. Adiati
Trihastuti, Cholis Hidayati, “Financial Performance Analysis of
Telecommunication Companies Listed on the Indonesia Stock Exchange (IDX) Year
2015-2019”, Journal of Economics, Finance and Management Studies ISSN (print):
2644-0490, ISSN (online): 2644-0504 Volume 5 Issue 05, May 2022.
[2] Gagan Shankhdhar, “The Study of
Financial Performance of Selected Companies in Telecom Sector”, European
Journal of Molecular & Clinical Medicine ISSN 2515-8260 Volume 08, Issue
02, 2021.
[3] Dr. Mohmad Mushtaq Khan, Dr. K.
Bhavana Raj, “Liquidity-Profitability Analysis & Prediction of Bankruptcy-
A Study of Select Telecom Companies”, Journal of Critical Reviews ISSN-
2394-5125 Vol 7, Issue 3, 2020.
[4] Mr. Bhavik Barot Dr Gurudutta P
Japee, “A Study on Financial Performance Of Selected Telecom Companies In
India”, https://hrdc.gujaratuniversity.ac.in/Publication,
Vol.13. Issue No. 2, 2021.
[5] Chopra, S., & Chawla, P.,
“Innovation, growth and intellectual property: a study of the Indian Telecom
sector and the way forward”, Journal of National Law University Delhi, 5(1),
40-60, 2018.
[6] Singh, R., “Impact of Reliance
JIO on Indian Telecom Industry: an empirical study”, International Journal of
Scientific Research and Management, 5(7), 6469-6474, 2017.
[7] Adebayo, A. A., & Ekejiuba,
C. O., “A review of the contributions of telecommunications to the economic
growth of Nigeria”, International Journal of Electrical Electronic Engineering,
3(2), 10-13, 2016.
[8] Raza, D., “Financial Performance
of Indian Telecom Industry: A Comparative Study of Bharat Sanchar Nigam Limited
and Bharti Airtel”, Asian Journal of Research in Business Economics and
Management, 5(4), 135-146, 2015.
[9] Dr. Marimuthu, Kn, Dr. Syed
Azhar and Dr. B. Ramesh (2019), “Financial Health of Select Telecom companies
in India”. Think India Journal, Volume 22, Issue 10, November 2019, pp
8797-8802, 2019.
[10] Ajmera Tushar R., “Financial
Indicators of Selected Service-Provider Companies of Telecommunication Sector
in India: An Empirical Study”. Journal of Advanced Research in Economics and
Administrative Sciences, Volume: 1, Issue 1, pp 23- 31, 2020.
[11] Suruchi Satsangi and Prof. Prem
Das Saini, “A study on Pre and Post Financial Performance of Mergers and
Acquisitions: A case study of Bharti Airtel”. UNNAYAN: International Bulletin
of Management and Economics, Volume: 11, pp 109-117, 2019.
[12] Thomas Joy and Sumeet Bahl,
“Disruption by Reliance Jio in Telecom Industry”. International Journal of Pure
and Applied Mathematics, Volume: 118, Issue 20, pp 43-49, 2018.
[13] Atashi Bedi, “Post Acquisition
Performance of Indian Telecom Companies: An Empirical Study”. Pacific Business
Review International, Volume: 11, Issue 2, pp 56-62, 2018.
[14] Dr. Papori Baruah and Rashmi
Baruah (2014), “Telecom Sector in India: Past, Present and Future”.
International Journal of Humanities & Social Science Studies, Volume: 1,
Issue 3, pp. 147-156, 2014.